
Three.js Data Visualization Examples
Three.js can present data in ways that flat charts cannot. These demos cover familiar chart types in 3D, such as bar charts, candlestick stock charts, treemaps, Sankey diagrams, heat maps and scatter plot matrices, as well as spatial views like an interactive globe, hex-binned population maps and wind-particle weather maps.
Network and hierarchy views include force-directed graphs, supply-chain flows, tournament brackets, family trees and a fly-through timeline of history. Each demo explains how data maps to geometry and how to keep thousands of data points interactive with picking, tooltips and filtering.
Most viewed in data visualization
All data visualization demos
15 Demos
Interactive 3D Bar Chart in Three.js
Interactive Three.js 3D bar chart for dataset comparison with animated transitions, hover feedback, dynamic scaling, and orbitable camera controls for exploratory data visualization.

Interactive 3D Globe in Three.js
Interactive Three.js 3D globe visualization with geospatial location pins, latitude/longitude grid overlays, smooth auto-rotation, and configurable styling for geographic data storytelling and map-based dashboards.
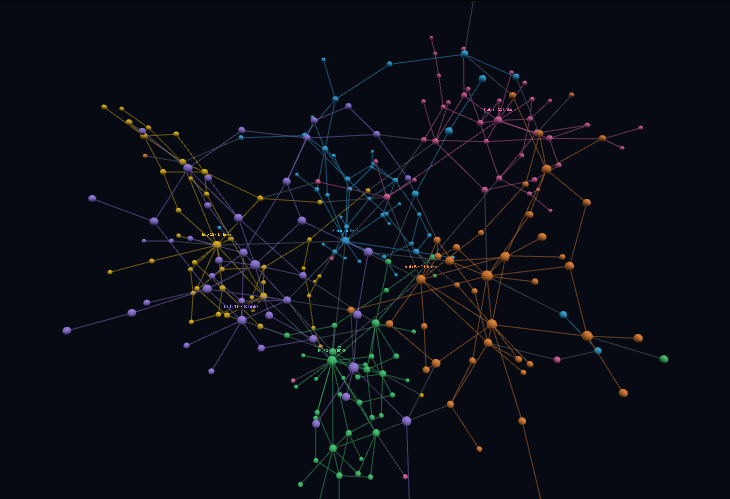
Three.js Force-Directed Network Graph (3D)
An interactive force-directed network graph in Three.js, laying out hundreds of nodes from a community-structured random graph with Coulomb repulsion, spring links and cooling, sized by degree, coloured by community, with neighbour highlighting on hover.
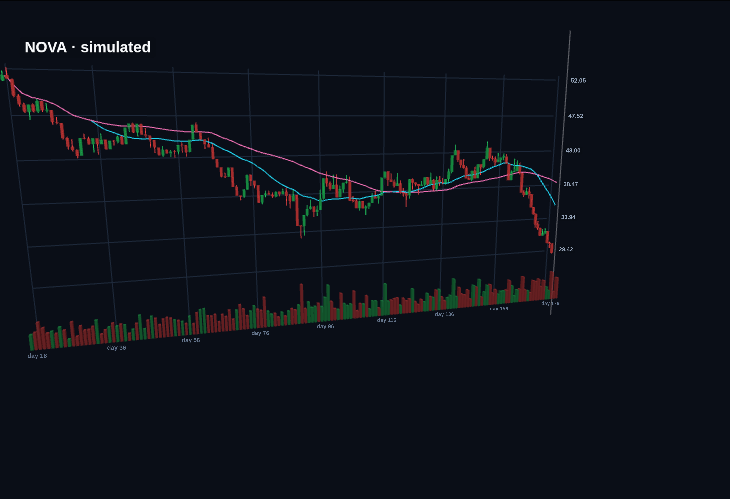
Three.js 3D Stock Chart (Candlesticks, Volume & Moving Averages)
A live financial chart in Three.js, with instanced candlesticks, volume bars and 20/50-day moving averages for simulated tickers that stream new trading days, plus a comparison view of every ticker's return as stacked 3D ribbons.
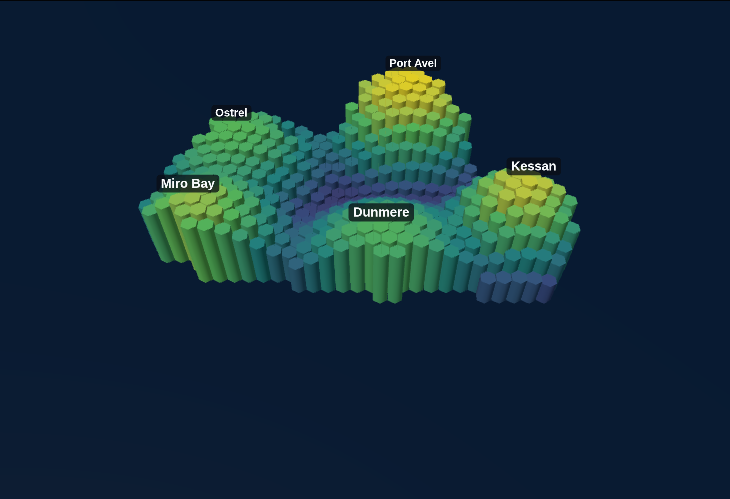
Three.js Population Density Hex Map
A 3D hex-bin population map in Three.js over a procedural nation, where Zipf-sized coastal cities grow and sprawl from 1900 to 2025 as extruded hexagonal prisms coloured with viridis on a log or linear scale.
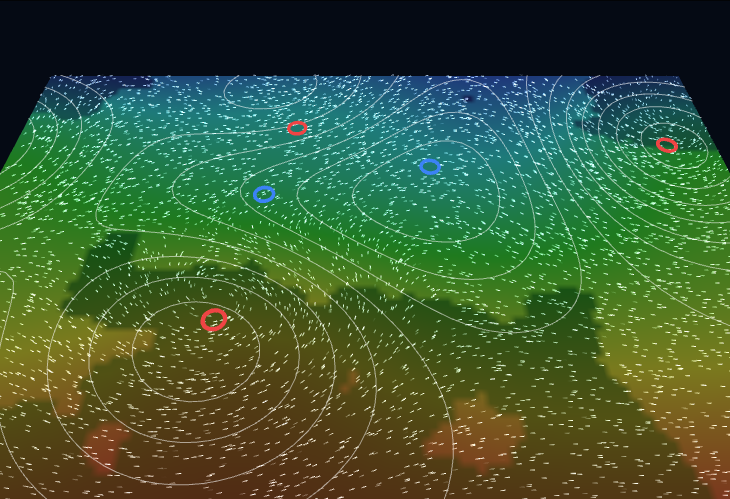
Three.js Weather Map (Wind Particles, Isobars & Pressure Systems)
A meteorological visualization in Three.js, with thousands of wind tracers streaming around drifting low- and high-pressure systems, isobars from marching squares, and switchable temperature or pressure shading.
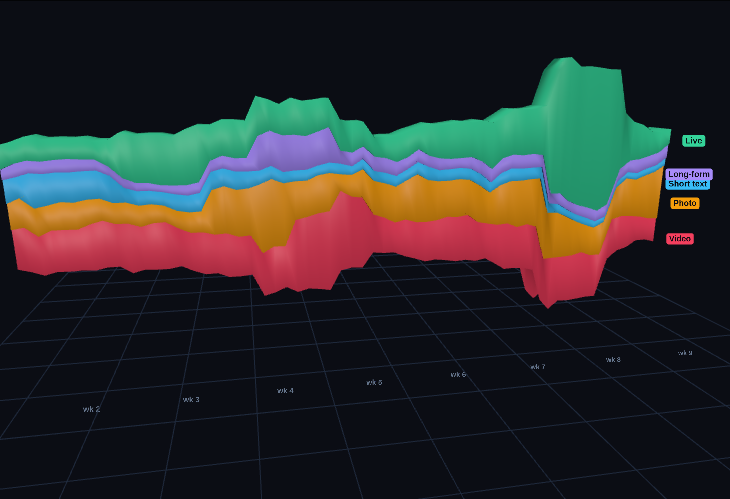
Three.js Social Media Analytics (Streamgraph & Bubble Chart)
Engagement analytics in Three.js for 60 days of synthetic posts across five content channels, shown as an extruded 3D streamgraph or a log-scale bubble chart with reach as size and hover details.
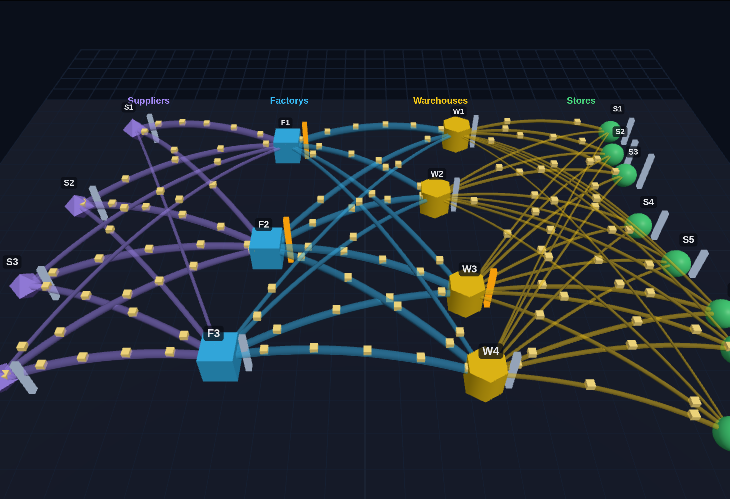
Three.js Supply Chain Network Flow Visualization
A four-tier logistics network in Three.js (suppliers, factories, warehouses, stores) with flow-weighted 3D arcs, animated shipments, utilisation bars, and the ability to knock a node offline and watch flows re-route.
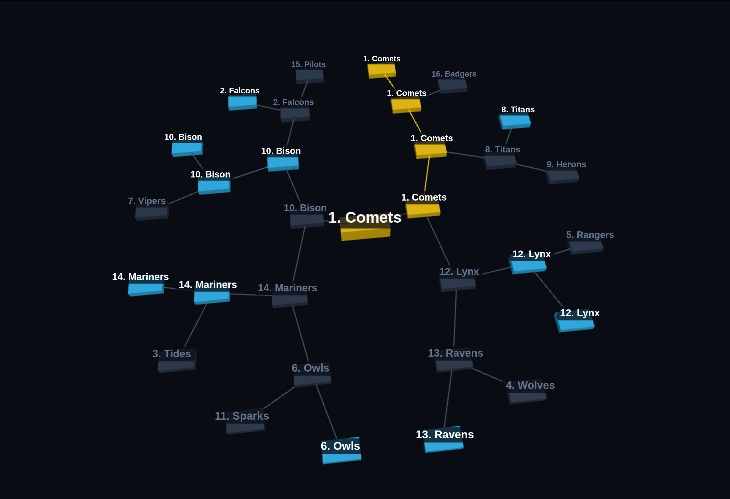
Three.js Tournament Bracket (Radial, Elo Simulation)
A 16-team single-elimination bracket in Three.js, laid out radially or classically, with matches simulated round by round from Elo win probabilities, the champion's path highlighted and title odds from 2,000 Monte-Carlo tournaments.
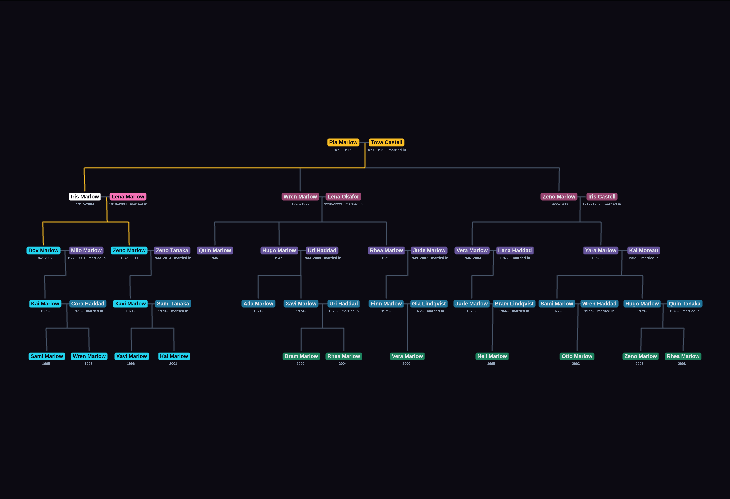
Three.js Family Tree (Genealogy Visualization)
A generated multi-generation family tree in Three.js with a tidy layout by subtree width, couples, married-in partners, and ancestor and descendant highlighting that cycles through family members.
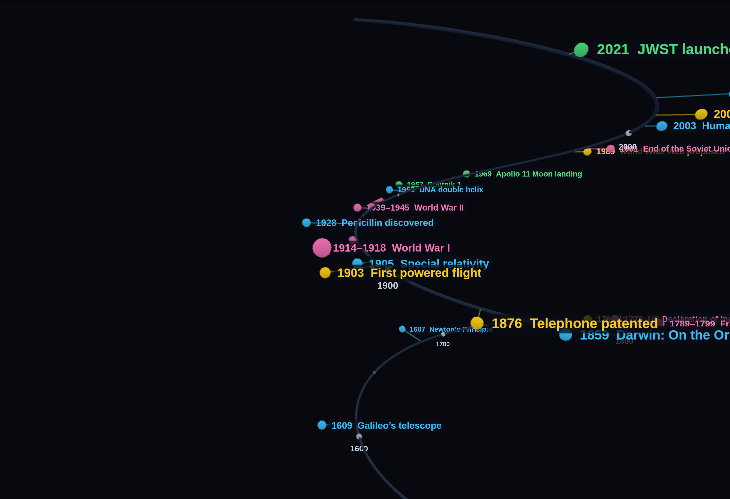
Three.js 3D Timeline of History (Helix Fly-Through)
Six centuries of milestones in science, technology, exploration and politics on a 3D helix or straight rail in Three.js, with a compressed time scale, spans drawn as arcs and a fly-through camera.
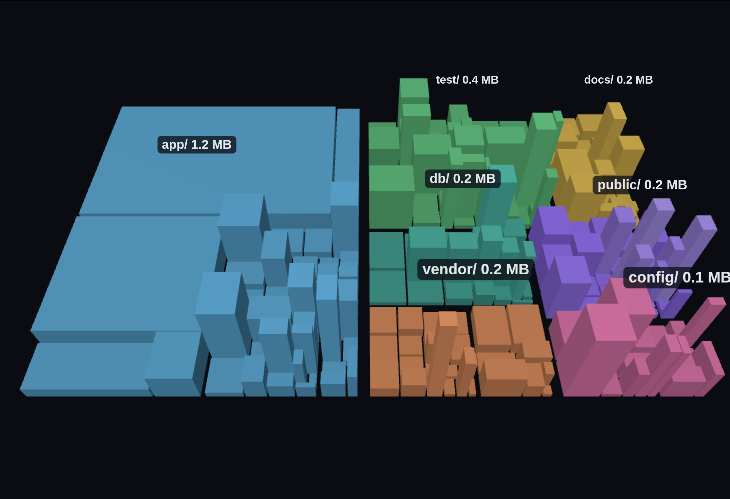
Three.js 3D Treemap (Squarified, Drill-Down)
Hierarchical data as a 3D squarified treemap in Three.js, showing a synthetic code repository with area as file size, height as recent changes, colour by top-level folder, nesting depth control and click to drill down.
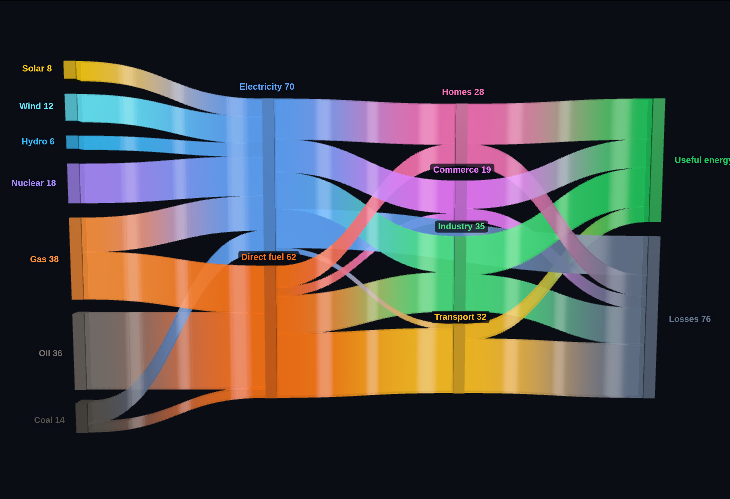
Three.js 3D Sankey Diagram (Energy Flow)
An extruded 3D Sankey diagram in Three.js tracing an illustrative energy system from primary sources through electricity and fuels to end-use sectors and useful energy versus losses, with flowing gradient ribbons and node tracing.
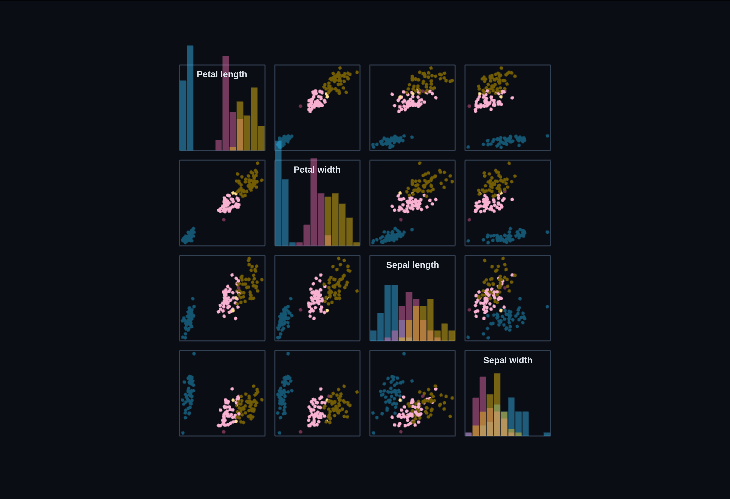
Three.js Scatter Plot Matrix (SPLOM) with Linked Brushing
A scatter-plot matrix in Three.js showing every pair of four features for three species, with histograms on the diagonal, linked brushing that highlights samples across all panels, and a rotating 3D scatter of any three features.
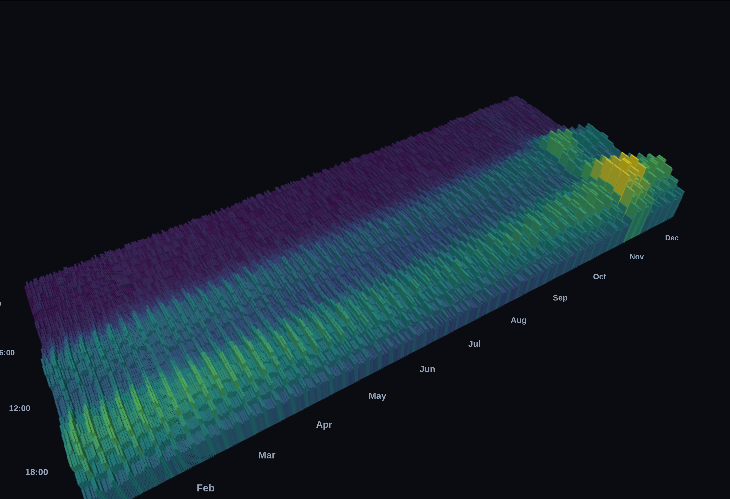
Three.js 3D Heat Map (Hour × Day Calendar)
A full year of hourly data as a 3D heat map in Three.js, with 8,760 cells as instanced bars or a displaced surface, perceptual colour maps, smoothing, and datasets showing daily, weekly and seasonal cycles.